Data Visualisation
The Data Science Stack
The entire data science process, as defined by Ben Fry, consists of 3 main phases, with data visualisation as the end product.
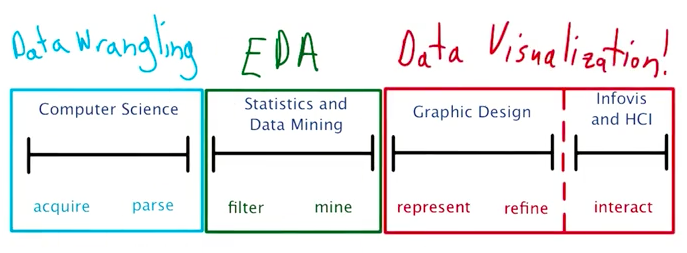
from Udacity’s data visualisation & d3.js course
- Computer Science: The first phase consists of the ETL process and database creation.
- Statistics and Data Mining: The second phase consists of exploratory analysis, model construction and validation.
- Graphic Design: The final phase consists of the creation and presentaion of data visualisations.
Two Types of Visualisations
Data visualisations can be broadly defined as exploratory and explanatory visualisations.
Exploratory visualisations allows the user to explore and play around with the data. It is usually done at phase 2 of data science process. It is a conversation between the data and oneself.
Explanatory visualisations has the aim to present to the end-user with a message to convey. It is the final phase of the data science process. It is a conversation between the data and the audience.
Visualisation Stack
Just like programming languages, data visualisation has a low level to high level grouping. High level visualisation tools are very often very easy to use but less flexible, while low level visualisation tools are difficult to learn and create, but has all the flexibility.
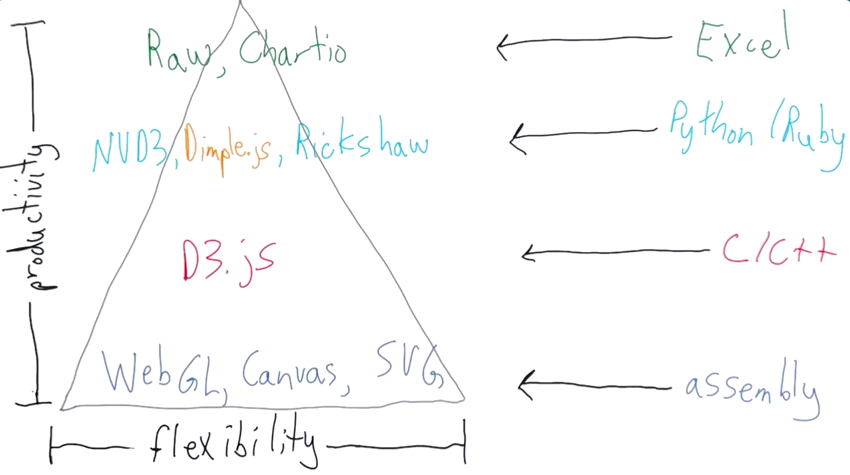
from Udacity’s data visualisation & d3.js course