D3.JS
Data Driven Documents is a popular javascript library used for web data visualisations. It is created by Mike Bostock. See more from its github page.
Chains
The concept of D3 uses chaining to link sequential methods together. This makes it easy to apply multiple operations to the same element.
Scales
D3 scaling works similar to a normal x-y scale, with the important exception that the y-axis increase downwards instead of upwards.
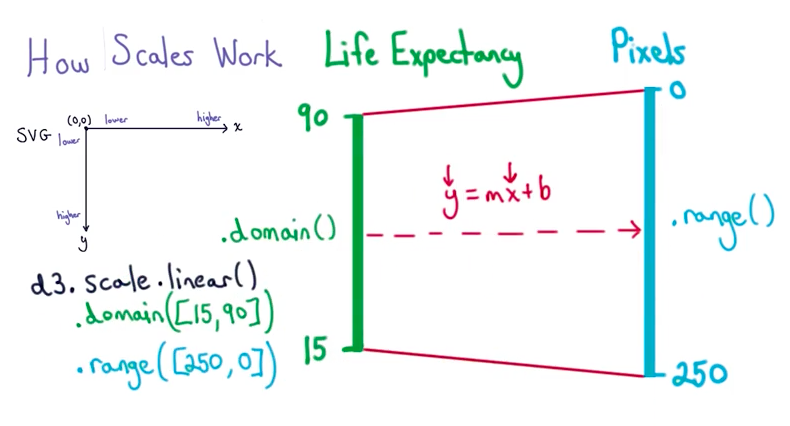
from Udacity’s data visualisation & d3.js course
To translate the actual scale into d3 scale, there is a need to map both together. Domain scale refers to the range of actual value, while Range scale refers to the D3 range of values.
// gapminder China graph
// note the inverse scale of y-axis
var y = d3.scale.linear().domain([15,90]).range([250,0]);
// for x-axis, it is a normal scale
var x = d3.scale.log().domain([250,1000]).range([0,600]);
// for circle sizing scale
var r = d3.scale.sqrt().domain([52070,138000000]).range([10,50])
// create an svg circle, with red fill, radius input, x and y inputs
svg.append('circle').attr('fill','red').attr('r',r(138000000)).attr('cx',x(1330)).attr('cy',y(77))
